2015-09-04 に行われた, 「統計的言語研究の現在」で, 久保先生のご講演「カウントデータの統計モデリング入門」を拝聴したので, Rでトレースしてみました。間違いを見つけたらご指摘頂ければと思います。
はじめに
カウントデータ (count data) は非負の離散値のデータ。
2つのコーパス X0と X1において, 単語の品詞カテゴリ {A, B, C…I} の出現頻度が記録された架空のデータにおいて, コーパス間の各品詞カテゴリの出現頻度に差があるのかを分析する。たぶん単語の出現頻度と読み替えても良いと思うけど, ほとんどスパースになる気もするので品詞としていると思う。
Category
X    A  B  C  D  E  F  G  H  I
0 62 21 14 11 10 10  2  0  2
1 48 34 22 17 16  7  2  1  1
2×2分割表の分析
本題の2×9分割表を考える前により小さな問題として 2×2分割表から始める。検定が今回のテーマではないので, カイ二乗検定の話題は省略。
require(lattice)

# 2 x 2
d2 <- read.csv('data/d2x2.csv')
ct2 <- xtabs(y ~ X + Category, data=d2)

plot(ct2 , col=c('cyan', 'magenta'))

xyplot(log(y) ~ factor(X), data = d2, groups = Category, type = 'b')

model.glm <- glm(ct2 ~ c(0,1), family = binomial)
summary(model.glm)
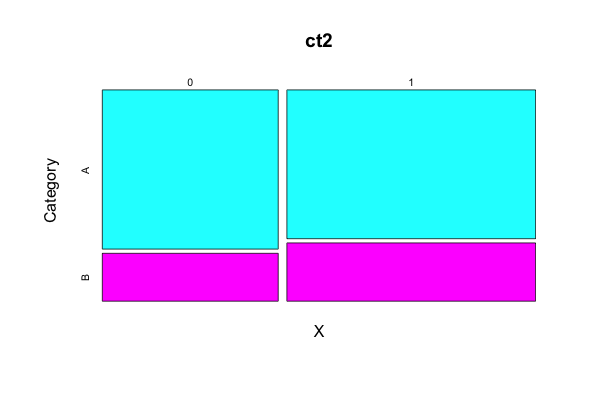
xtabsで分割表をつくり, plotで表示。
Category
X     A   B
0 286  86
1 378 148
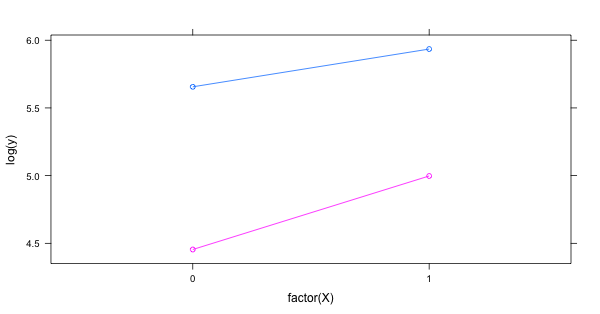
lattice::xyplot でコーパス間の各品詞カテゴリの出現頻度を確認する。
一般化線形モデル (GLM) のロジスティック回帰, ポアソン回帰でパラメータを推定する。
一般化線形モデルでは, 目的変数を変換する, リンク関数 (link function) を使う。リンク関数は単調かつ微分可能な関数である。
リンク関数を g(μ), デザイン行列を X, パラメータベクトルを β とすると下記で表すことができる。
ロジスティック回帰では, リンク関数 g にロジット関数を用いる。
以下のような 2×2分割表 では, オッズ比 (Odds Ratio, OR) は (ad) / (bc) で計算できる。
> matrix(c("a", "b", "c", "d"), ncol = 2)
     [,1] [,2]
[1,] "a"  "c"
[2,] "b"  "d"
対数オッズ比 (log OR) を求めると下記となり, これがロジスティック回帰の偏回帰係数 β となる。
 # coef
> log((286*148) / (86*378))
[1] -0.2639626
# std error
> sqrt(1/286 + 1/86 + 1/378 + 1/148)
[1] 0.1566099
この偏回帰係数は, アナロジー的には線形回帰の傾きに相当する。対数オッズ比の exp を取ると オッズ比となるので確率の比として解釈がしやすくなる。また, 対数オッズ比と標準誤差 (SE)から信頼区間が求まり, exp を取ったオッズ比の信頼区間が 1 を含むかも確認する。
glm() では下記のように書ける。
> model.glm <- glm(ct2 ~ c(0,1), family = binomial(link = logit))
> summary(model.glm)

Call:
glm(formula = ct2 ~ c(0, 1), family = binomial(link = logit))

Deviance Residuals:
[1]  0  0

Coefficients:
            Estimate Std. Error z value Pr(>|z|)
(Intercept)   1.2016     0.1230   9.771   <2e-16 ***
c(0, 1)      -0.2640     0.1566  -1.685   0.0919 .
---
Signif. codes:  0 ‘***’ 0.001 ‘**’ 0.01 ‘*’ 0.05 ‘.’ 0.1 ‘ ’ 1

(Dispersion parameter for binomial family taken to be 1)

    Null deviance: 2.8725e+00  on 1  degrees of freedom
Residual deviance: 5.0626e-14  on 0  degrees of freedom
AIC: 16.537

Number of Fisher Scoring iterations: 3
ポアソン回帰では一般的に, リンク関数 g(λ) に対数 (log) を用いる。品詞カテゴリAのみでモデリング。(分割モデルA)
Call:
glm(formula = y ~ X, family = poisson, data = d2[d2$Category == "A", ])

Deviance Residuals:
[1]  0  0

Coefficients:
            Estimate Std. Error z value Pr(>|z|)
(Intercept)  5.65599    0.05913  95.652  < 2e-16 ***
X            0.27890    0.07837   3.559 0.000373 ***
---
Signif. codes:  0 ‘***’ 0.001 ‘**’ 0.01 ‘*’ 0.05 ‘.’ 0.1 ‘ ’ 1

(Dispersion parameter for poisson family taken to be 1)

    Null deviance: 1.2788e+01  on 1  degrees of freedom
Residual deviance: 5.8620e-14  on 0  degrees of freedom
AIC: 19.268

Number of Fisher Scoring iterations: 2
ポアソン回帰, 品詞カテゴリBのみでモデリング。(分割モデルB)
Call:
glm(formula = y ~ X, family = poisson, data = d2[d2$Category == "B", ])

Deviance Residuals:
[1]  0  0

Coefficients:
            Estimate Std. Error z value Pr(>|z|)
(Intercept)   4.4543     0.1078  41.308  < 2e-16 ***
X             0.5429     0.1356   4.004 6.24e-05 ***
---
Signif. codes:  0 ‘***’ 0.001 ‘**’ 0.01 ‘*’ 0.05 ‘.’ 0.1 ‘ ’ 1

(Dispersion parameter for poisson family taken to be 1)

    Null deviance:  1.6625e+01  on 1  degrees of freedom
Residual deviance: -2.6645e-15  on 0  degrees of freedom
AIC: 17.13

Number of Fisher Scoring iterations: 2
ポアソン回帰, 交互作用あり版でモデリング。(一括モデル)
model.glm <- glm(y ~ X * Category, data=d2, family=poisson)
summary(model.glm)
一括モデルの結果が下記である。
Coefficients:
            Estimate Std. Error z value Pr(>|z|)
(Intercept)  5.65599    0.05913  95.652  < 2e-16 ***
X            0.27890    0.07837   3.559 0.000373 ***
CategoryB   -1.20164    0.12298  -9.771  < 2e-16 ***
X:CategoryB  0.26396    0.15661   1.685 0.091896 .
---
Signif. codes:  0 ‘***’ 0.001 ‘**’ 0.01 ‘*’ 0.05 ‘.’ 0.1 ‘ ’ 1

(Dispersion parameter for poisson family taken to be 1)

    Null deviance: 2.4401e+02  on 3  degrees of freedom
Residual deviance: 1.3323e-15  on 0  degrees of freedom
AIC: 36.398
分割モデルAの推定値 (Intercept) 5.65599 と X 0.27890 が一括モデルと一致しており, 分割モデルBの推定値 (Intercept) 4.4543 と X 0.5429 はそれぞれ一括モデルの (Intercept) – CategoryB と X + X:CategoryB に一致している。
2×3分割表の分析
続いて, カテゴリを1つ追加した2×3 分割表について。追加したカテゴリCは各コーパスで出現頻度がA, Bと比べ出現回数が極端に低くなっている。
Category
X     A   B   C
0 286  86   7
1 378 148  17
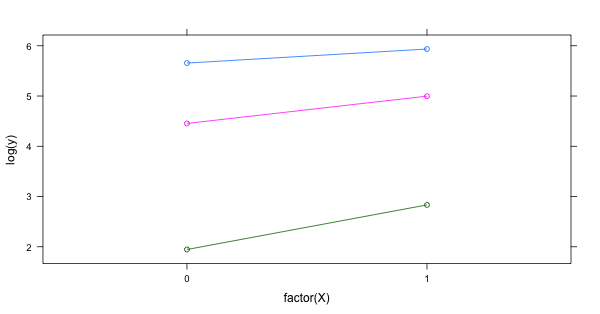
2×2同様にxyplotで表示。
多項分布 (三項分布) になるが, まずはポアソン回帰。
Call:
glm(formula = y ~ X * Category, family = poisson, data = d3)

Deviance Residuals:
[1]  0  0  0  0  0  0

Coefficients:
            Estimate Std. Error z value Pr(>|z|)
(Intercept)  5.65599    0.05913  95.652  < 2e-16 ***
X            0.27890    0.07837   3.559 0.000373 ***
CategoryB   -1.20164    0.12298  -9.771  < 2e-16 ***
CategoryC   -3.71008    0.38256  -9.698  < 2e-16 ***
X:CategoryB  0.26396    0.15661   1.685 0.091896 .
X:CategoryC  0.60840    0.45588   1.335 0.182015
---
Signif. codes:  0 ‘***’ 0.001 ‘**’ 0.01 ‘*’ 0.05 ‘.’ 0.1 ‘ ’ 1

(Dispersion parameter for poisson family taken to be 1)

    Null deviance: 8.0676e+02  on 5  degrees of freedom
Residual deviance: 5.9952e-15  on 0  degrees of freedom
AIC: 48.887
glmではロジスティック回帰で多項分布を指定できないので nnmet::multnom を使う。
multinom(ct3 ~ c(0, 1))
ポアソン回帰とほぼ同じ結果が得られた。
#weights:  9 (4 variable)
initial  value 1012.920530
iter  10 value 624.205679
final  value 624.205639
converged
Call:
multinom(formula = ct3 ~ c(0, 1))

Coefficients:
  (Intercept)   c(0, 1)
B   -1.201520 0.2638671
C   -3.709631 0.6076266

Residual Deviance: 1248.411
AIC: 1256.411
2×9分割表の分析
冒頭に書いた, 2つのコーパス X0と X1において, 単語の品詞カテゴリ{A, B, C…I} の出現頻度を記録した架空データについて考える。
Category
X    A  B  C  D  E  F  G  H  I
0 62 21 14 11 10 10  2  0  2
1 48 34 22 17 16  7  2  1  1
コーパスX0には, カテゴリHが一度も出現していない。
2×3分割表と同様に, まずはポアソン回帰で分析してみる。
require(lattice)
require(glmmML)

d9 <- read.csv('data/d2x9.csv')
ct9 <- xtabs(y ~ X + Category, data=d9)

plot(ct9)

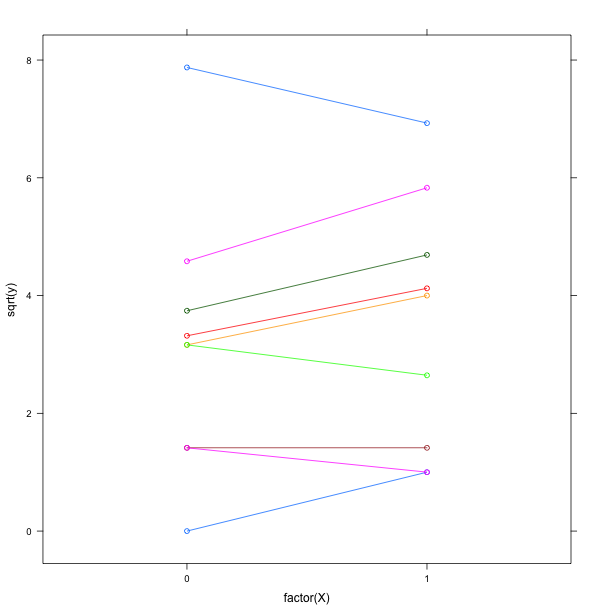
xyplot(sqrt(y) ~ factor(X), data = d9, groups = Category, type = 'b')

model.glm <- glm(y ~ X * Category, data = d9, family = poisson)
summary(model.glm)
分割表が大きくなった時, カテゴリ (個体)によるバラツキが大きいような過分散が起きている場合では, パラメータの推定値の信頼性がバラバラになってしまう。特に0を含むスパースな部分を上手く推定することが難しい。例えば, ポアソン回帰だと CategoryHの推定値が -26.4 であるが, expの中をいくら小さくしても実際の値である 0とはならない。
Coefficients:
              Estimate Std. Error z value Pr(>|z|)
(Intercept)     4.1271     0.1270  32.497  < 2e-16 ***
X              -0.2559     0.1923  -1.331   0.1831
CategoryB      -1.0826     0.2525  -4.288 1.80e-05 ***
CategoryC      -1.4881     0.2959  -5.029 4.93e-07 ***
CategoryD      -1.7292     0.3272  -5.285 1.25e-07 ***
CategoryE      -1.8245     0.3408  -5.354 8.60e-08 ***
CategoryF      -1.8245     0.3408  -5.354 8.60e-08 ***
CategoryG      -3.4340     0.7184  -4.780 1.75e-06 ***
CategoryH     -26.4297 42247.1657  -0.001   0.9995
CategoryI      -3.4340     0.7184  -4.780 1.75e-06 ***
X:CategoryB     0.7378     0.3376   2.185   0.0289 *
X:CategoryC     0.7079     0.3922   1.805   0.0711 .
X:CategoryD     0.6913     0.4321   1.600   0.1096
X:CategoryE     0.7259     0.4466   1.625   0.1041
X:CategoryF    -0.1007     0.5290  -0.190   0.8490
X:CategoryG     0.2559     1.0183   0.251   0.8016
X:CategoryH    22.5585 42247.1657   0.001   0.9996
X:CategoryI    -0.4372     1.2397  -0.353   0.7243
glmの限界を感じはじめたので, 個体差も考慮するようなモデルを考える。
一般化線形混合モデル(GLMM)で, 線形予測子を全体を表現するパラメータ(global param)と個体差を表現するパラメータ (local param)に分離する。{glmmML}を使う。
model.glmm <- glmmML(y ~ X, data=d9, cluster = Category, family = poisson)
summary(model.glmm)
summary()で全体的なパラメータの推定値が出力される。また, posterior.modesは Estimated posterior modes of the random effects. なので直訳すると, 推定されたランダム効果の事後分布の最頻値 となると思うが, 個体差のパラメータが出力される。
Call:  glmmML(formula = y ~ X, family = poisson, data = d9, cluster = Category)

              coef se(coef)      z Pr(>|z|)
(Intercept) 2.0117   0.4654 4.3227 1.54e-05
X           0.1144   0.1197 0.9557 3.39e-01

Scale parameter in mixing distribution:  1.33 gaussian
Std. Error:                              0.314

        LR p-value for H_0: sigma = 0:  5.561e-54

Residual deviance: 50.71 on 15 degrees of freedom 	AIC: 56.71

model.glmm$posterior.modes
[1]  1.9268622  1.2309349  0.8070984  0.5572246  0.4838544  0.0673045 -1.2185223 -2.0058464 -1.4269678
glmmML()によって glm() におけるゼロデータ問題は解決できたが, より複雑な階層ベイズモデルに対して扱うのは難しくなってくる。
そこで, MCMC法によるベイジアンモデリングが登場する。MCMCでパラメータの事後分布のサンプリングを行う。
今回, MCMCサンプラーはJAGSではなく, Stanで試してみる。
stan_code <- '
  data {
    int<lower=1> n;
    int x[n];
    int<lower=0> y[n];
  }

  parameters {
    real a0;
    real b1;
    vector[n] r;
    real s_r;
  }

  model {
    for(i in 1:n) {
      y[i] ~ poisson_log(a0 + b1 * x[i] + r[i]);
      r[i] ~ normal(0, s_r);
    }
  }
'

d <- list(
    n=9,
    y=d9$y[0:9], # [1] 62 21 14 11 10 10  2  0  2
    x=d9$y[0:9] - d9$y[10:18] # [1]  14 -13  -8  -6  -6   3   0  -1   1
)

d.fit <- stan(model_code=stan_code, data=d, iter=1000, chains=4)
print(d.fit, digit=2)
</lower=0></lower=1>
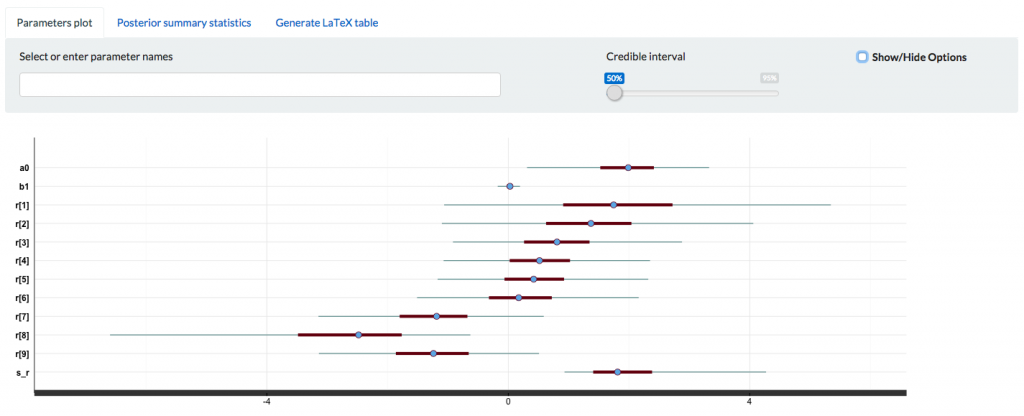
CategoryD, Eは信用区間の幅が狭く確信度が強い一方で, 特にCategoryHは幅が広くなっており確信度が弱くなっている。
Inference for Stan model: stan_code.
4 chains, each with iter=1000; warmup=500; thin=1;
post-warmup draws per chain=500, total post-warmup draws=2000.

       mean se_mean   sd   2.5%    25%    50%    75%  97.5% n_eff Rhat
a0     1.95    0.04 0.74   0.31   1.52   1.99   2.41   3.33   405 1.01
b1     0.02    0.00 0.09  -0.18  -0.03   0.03   0.08   0.19   576 1.00
r[1]   1.83    0.07 1.65  -1.06   0.91   1.75   2.72   5.35   539 1.01
r[2]   1.37    0.06 1.23  -1.10   0.63   1.37   2.04   4.06   446 1.00
r[3]   0.83    0.04 0.92  -0.92   0.26   0.81   1.35   2.88   454 1.00
r[4]   0.54    0.04 0.84  -1.07   0.02   0.52   1.02   2.35   414 1.00
r[5]   0.44    0.04 0.83  -1.17  -0.06   0.42   0.92   2.32   470 1.00
r[6]   0.22    0.04 0.90  -1.51  -0.32   0.17   0.72   2.16   485 1.01
r[7]  -1.23    0.04 0.93  -3.15  -1.80  -1.19  -0.68   0.59   543 1.01
r[8]  -2.78    0.07 1.49  -6.60  -3.48  -2.48  -1.77  -0.63   490 1.00
r[9]  -1.27    0.04 0.96  -3.14  -1.86  -1.24  -0.66   0.51   504 1.00
s_r    2.00    0.05 0.86   0.93   1.41   1.81   2.38   4.27   287 1.01
lp__ 285.63    0.17 2.96 279.18 283.87 285.98 287.78 290.40   312 1.02

Samples were drawn using NUTS(diag_e) at Mon Sep  7 22:20:56 2015.
For each parameter, n_eff is a crude measure of effective sample size,
and Rhat is the potential scale reduction factor on split chains (at
convergence, Rhat=1).
stanfit objectを shinystan::launch_shinystan() で localhost にサービスが起動するのでブラウザからアクセスする。[1]
おわりに
参考書籍は『データ解析のための統計モデリング入門――一般化線形モデル・階層ベイズモデル・MCMC (確率と情報の科学)』です。
[1] shinystan
[2] ポアソン分布に従うのは生起頻度が非常に低い事象の観測データで, 仮定として希少性, 定常性(事象の起きる確率は時間帯に依らない), 独立性 (事象の起きる確率はそれ以前の事象と無関係) がある。パラメータ λ は単位時間当たりの平均生起回数。
