確率的勾配降下法を書こうと思い, 学習の参考となる実装を Webで探してみると Python実装が多く, 中でも NumPy, Matplotlibを使っている例が多かった。[1]
せっかくなので Go (1.4.1)で書いてみようと思い Goで NumPyにあたる行列計算パッケージと Matplotlibにあたるプロット系のパッケージを探していたところ, gonum/matrix と gonum/plotが, 良さそうで触ってみた。
gonum/matrix
gonum/matrix はGoの行列計算パッケージ。内部的には blas (Basic Linear Algebra Subprograms)を使っている。
numpy との対応関係を探すのに時間がかかってしまった。Dense, Matrix, Vectorあたりの型を覚えないと上手く使いこなせないかも。
行列積, 要素積, 内積の例。
package main

import (
	"fmt"

	"github.com/gonum/matrix/mat64"
)

func main() {
	m := mat64.NewDense(3, 3, []float64{
		1, 2, 3,
		4, 5, 6,
		7, 8, 9,
	})

	m2 := mat64.NewDense(3, 3, []float64{
		1, 0, 0,
		0, 1, 0,
		0, 0, 1,
	})

	// 行列積 (Matrix multiplication)
	m3 := mat64.NewDense(3, 3, nil)
	m3.Mul(m, m2)
	fmt.Println(mat64.Formatted(m3))
	// ⎡1  2  3⎤
	// ⎢4  5  6⎥
	// ⎣7  8  9⎦

	// 要素積 (Element-wise product)
	m4 := mat64.NewDense(3, 3, nil)
	m4.MulElem(m, m2)
	fmt.Println(mat64.Formatted(m4))
	// ⎡1  0  0⎤
	// ⎢0  5  0⎥
	// ⎣0  0  9⎦

	// 要素積の合計 (sum of the element-wise products of the elements)
	fmt.Println(mat64.Dot(m, m2))
	// 15

	// 内積 (Inner product)
	fmt.Println(mat64.Inner(m.ColView(1), m, m.ColView(2)))
	// 1764
}
詳しくは mat64のGoDoc を参考に。
gonum/plot
gonum/plot はGoの可視化パッケージ。使い方は Example-plots を参考にすると大体わかる。
plotter は lines, scatter, box, histogram, bubbles, heat, gridなどのプリミティブな plot typesを提供している。
plotutil は幾つかの plot typesを簡単に扱えるAPIを提供している。plot/plotutil/add.go を見てみると下記がサポートされている。
- AddStackedAreaPlots :積み上げ折れ線グラフ
- AddBoxPlots : 箱ひげ図
- AddLines : 折れ線グラフ
- AddLinePoints : 折れ線グラフ + 点
- AddErrorBars : x, y軸にエラーバー (標準誤差や信頼区間を表現)
- AddXErrorBars : x軸にエラーバー
- AddYErrorBars : y軸にエラーバー
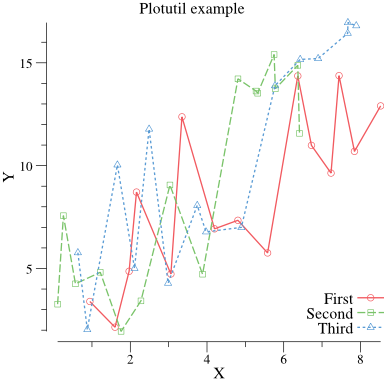
plotutil.AddLinePoints()を試してみる。
package main

import (
	"math/rand"

	"github.com/gonum/plot"
	"github.com/gonum/plot/plotter"
	"github.com/gonum/plot/plotutil"
	"github.com/gonum/plot/vg"
)

func main() {
	rand.Seed(int64(0))

	p, err := plot.New()
	if err != nil {
		panic(err)
	}

	p.Title.Text = "Plotutil example"
	p.X.Label.Text = "X"
	p.Y.Label.Text = "Y"

	err = plotutil.AddLinePoints(p,
		"First", randomPoints(15),
		"Second", randomPoints(15),
		"Third", randomPoints(15),
	)
	if err != nil {
		panic(err)
	}

	// Save the plot to a PNG file.
	if err := p.Save(4*vg.Inch, 4*vg.Inch, "img/points.png"); err != nil {
		panic(err)
	}
}

// randomPoints returns some random x, y points.
func randomPoints(n int) plotter.XYs {
	pts := make(plotter.XYs, n)
	for i := range pts {
		if i == 0 {
			pts[i].X = rand.Float64()
		} else {
			pts[i].X = pts[i-1].X + rand.Float64()
		}
		pts[i].Y = pts[i].X + 10*rand.Float64()
	}
	return pts
}
出力された図は下記。
確率的勾配降下法
ようやく本題。Goで確率的勾配降下法を用いたロジスティック回帰による2値分類器を書いてみる。
最適化手法のひとつである 勾配法 (gradient method) とは 目的関数 L(ω) を最小化する手法で, 分類に成功すれば 0 , 失敗するとその値は大きくなる。
勾配降下法は L(ω) が収束するまでパラメータ ω を更新していく方法であるが, 一度にまとめて計算するため大きな行列になると, 計算リソースへの負荷が高まる。
確率的勾配降下法(stochastic gradient descent, SGD)は, 確率的勾配降下法は 1行ずつランダムに取り出し計算していくため, この負荷が比較的小さい。詳しくはアルゴリズムとコードの両方で参考にさせて頂いた Jupyter [2] を参考に。
目的関数 (objective function) または損失関数 (loss function) を最小化する重みを推定する。
ロジスティック回帰の場合, 損失関数は, ロジスティック損失で (−∞, ∞) 区間の実数を (0, 1) 区間に写像する シグモイド関数 σ が用いられる。
// Loss function
func Sigmoid(x float64) (y float64) {
	return 1.0 / (1.0 + math.Exp(-1*x))
}
勾配の近似には様々な手法が考えられ, Mini-batch SGD では 1行ずつランダムに取り出すのではなく, 指定したサイズ分の部分集合を取り出して勾配を計算していくため損失は安定して推移しやすい。
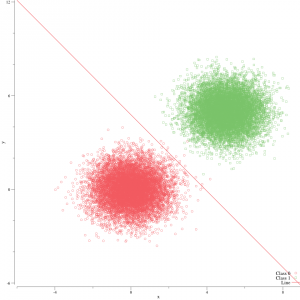
まず, 2つの正規分布から10,000点のサンプルを生成する。
(μ, σ) はそれぞれ (0, 1)と (5, 1)として, label値 y = 0, y = 1をつける。
⎡   0.3355783633826332     0.3075069223376545                      0⎤
⎢    4.644406713877847       3.18779626663706                      1⎥
⎢   1.3714689033418805    -1.5036720020678844                      0⎥
⎢    5.792039934488384      5.151017687843955                      1⎥
...
dataset を mini-batchに分けて, 確率的勾配降下法を用いてパラメータを更新していく。batch_sizeは 10 とした。仮に batch_size を 1 とすると ただの確率的勾配降下法となる。
η は勾配 (gradient) をパラメータ更新にどの程度, 反映させるかを決めるパラメータ。
	//  Minibatch SGD (minibatch stochastic gradient descent)
	for i := 0; i < N/batch_size; i++ {
		x_part, y_part := grad.DivideData(data, i*batch_size, batch_size)

		// batch processing
		w_grad, b_grad := g.Grad(x_part, y_part, batch_size)

		// Update parameters
		g.Weight[0] -= eta * w_grad[0]
		g.Weight[1] -= eta * w_grad[1]
		g.Intercept -= eta * b_grad[0]

		yhat := g.CalcLikeLihood(x, N)
		err_sum := 0.0
		for i := 0; i < len(yhat); i++ {
			err_sum += math.Abs(y[i] - yhat[i])
		}

		g.Errors = append(g.Errors, err_sum/float64(len(yhat)))
	}
ロジスティック回帰における目的関数。
// objective function (calc conditional-prob): p(y|x) = 1 / 1 + exp(-y w x)
func (g *Grad) CalcLikeLihood(x *mat64.Dense, s int) (yhat []float64) {
	m := MulMulti(x, g.Weight, s) // like numpy.dot()

	for i := 0; i < len(m); i++ {
		yhat = append(yhat, Sigmoid(m[i]+g.Intercept))
	}
	return yhat
}
勾配を計算する関数。目的関数を最小化するようなパラメータを求めていく。
func (g *Grad) Grad(x *mat64.Dense, y []float64, s int) (w_grad, b_grad []float64) {
	errs := []float64{}

	yhat := g.CalcLikeLihood(x, s)

	for i := 0; i < len(y); i++ {
		errs = append(errs, y[i]-yhat[i]) // error = label - pred
	}
	e := mat64.NewVector(s, errs)

	w_grad = append(w_grad, -1*mat64.Dot(x.ColView(0), e))
	w_grad = append(w_grad, -1*mat64.Dot(x.ColView(1), e))
	b_grad = append(b_grad, -1*Mean(errs))

	return w_grad, b_grad
}
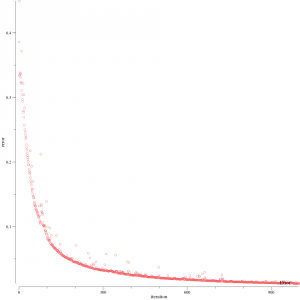
繰り返していくと, 十分にシャッフルされていれば mini-batch に分割していることにより損失は早い段階で収束していく。
分類結果。
CodeはGithubに置いた。
おわりに
gonum/matrix, gonum/plot を調べるのに全体の7割くらいの時間がかかってしまった。
実は, まだ dataset をシャッフルする所を書いていないので確率的 (計算機的にランダムに選択している)とは言えないです。
間違いを発見された方は, ご指摘いただけると幸いです。
[1] ロジスティック回帰 (勾配降下法 / 確率的勾配降下法) を可視化する
[2] 1次元ロジスティック回帰
[3] SGD+α: 確率的勾配降下法の現在と未来


