sysstat はシステム監視 (system monitoring) のツールです。今回は sar で収集したシステムに関するデータを R で可視化してみます。
環境は Ubuntu14.04 です。
sar
sar (system admin reporter) はシステムの性能測定や負荷テストを行いたいときに便利なコマンド。
$ sar -V
sysstat version 10.2.0
(C) Sebastien Godard (sysstat  orange.fr)
Ubuntu では デフォルトで sysstat のデータ収集が Disable になっているので /etc/default/sysstat の `ENABLED=”false”` を ENABLED=”true” に変更する。
$ sar
Cannot open /var/log/sysstat/sa08: No such file or directory
Please check if data collecting is enabled in /etc/default/sysstat
また, RHEL/CentOS の場合は以下。(取得間隔の設定は /etc/cron.d/sysstat )
$ sudo systemctl enable sysstat
$ sudo systemctl start sysstat
収集できるシステム情報は以下。(一部)
[-W] スワップ
| 項目 | 説明 |
|---|---|
| pswpin/s | スワップインしたページ数 / 秒 |
| pswpout/s | スワップアウトしたページ数 / 秒 |
[-r] メモリ
| 項目 | 説明 |
|---|---|
| kbmemfree | 空いている物理メモリ (KB) |
| kbmemused | 使用中の物理メモリ (KB) |
| %memused | 物理メモリの使用率 (%) |
| kbbuffers | バッファとして使用されている物理メモリ (KB) |
| kbcached | キャッシュとして使用されている物理メモリ (KB) |
| kbcommit | 事前に確保されているメモリ (KB) |
| %commit | 事前に確保されているメモリの割合 (%) |
[-n DEV] ネットワーク
| 項目 | 説明 |
|---|---|
| rxpck/s | 受信パケット数 / 秒 |
| txpck/s | 送信パケット数 / 秒 |
| rxkB/s | 受信データサイズ (KB/秒) |
| txkB/s | 送信データサイズ (KB/秒) |
| rxcmp/s | 圧縮受信パケット数 / 秒 |
| txcmp/s | 圧縮送信パケット数 / 秒 |
| rxmcst/s | マルチキャスト受信パケット数 / 秒 |
[-b] ディスクIO
| <項目/th> | 説明 |
|---|---|
| tps | IOリクエスト数 / 秒 |
| rtps | 読み込みIOリクエスト数 / 秒 |
| wtps | 書き込みIOリクエスト数 / 秒 |
| bread/s | 読み込みデータ量 / 秒 |
| bwrtn/s | 書き込みデータ量 / 秒 |
[-q] ロードアベレージ
| 項目 | 説明 |
|---|---|
| runq-sz | 実行待ちのキューに入っているプロセス数 |
| splist-sz | プロセスリスト中のプロセス数とスレッド数 |
| ldavg-x | 過去x分間のロードアベレージ |
[-u] CPU
| 項目 | 説明 |
|---|---|
| %user | ユーザが利用しているCPU使用率 (%) |
| %nice | %nice値を変更して実行されたプロセスのCPU使用率 (%) |
| %system | カーネルが利用しているCPU使用率 (%) |
| %iowait | IO待ちしているCPU使用率 (%) |
| %steal | ゲストOSが割り当て要求をしたが割り当ててもらえなかったCPU使用率 (%) |
| %idle | 待機中のCPU使用率 (%) |
JSON で出力
JSON 出力は sadf コマンドの jオプションでできる。 `–` (hyphen x2)で sar のオプションを指定できる。
JSON 以外にも CSV (-d), XML (-x), さらに SVG をサポートしている。
$ sadf /var/log/sysstat/sa08 -t -s 22:35:00 -e 22:45:00 -j -- -A 2>&1 | tee -a sar.$(date '+%Y-%m-%dT%H:%M:%S').json
{"sysstat": {
        "sysdata-version": 2.17,
        "hosts": [
                {
                        "nodename": "ubuntu",
                        "sysname": "Linux",
                        "release": "3.13.0-100-generic",
                        "machine": "x86_64",
                        "number-of-cpus": 2,
                        "file-date": "2017-02-08",
                        "statistics": [
                                {
                                        "timestamp": {"date": "2017-02-08", "time": "22:40:01", "utc": 0, "interval": 300},
                                        "cpu-load-all": [
                                                {"cpu": "all", "usr": 0.11, "nice": 0.00, "sys": 0.17, "iowait": 0.00, "steal": 0.00, "irq": 0.00, "soft": 0.00, "guest": 0.00, "gnice": 0.00, "idle": 99.72},
                                                {"cpu": "0", "usr": 0.08, "nice": 0.00, "sys": 0.12,"iowait": 0.00, "steal": 0.00, "irq": 0.00, "soft": 0.00, "guest": 0.00, "gnice": 0.00, "idle": 99.79},
                                                {"cpu": "1", "usr": 0.13, "nice": 0.00, "sys": 0.21,"iowait": 0.00, "steal": 0.00, "irq": 0.00, "soft": 0.00, "guest": 0.00, "gnice": 0.00, "idle": 99.65}
                                        ],
                                        "process-and-context-switch": {"proc": 0.07, "cswch": 101.68},
                                        "swap-pages": {"pswpin": 0.06, "pswpout": 0.00},
                                        "paging": {"pgpgin": 0.27, "pgpgout": 1.29, "fault": 42.97, "majflt": 0.02, "pgfree": 27.53, "pgscank": 0.00, "pgscand": 0.00, "pgsteal": 0.00, "vmeff-percent": 0.00},
                                        "io": {"tps": 0.23, "io-reads": {"rtps": 0.03, "bread": 0.53}, "io-writes": {"wtps": 0.20, "bwrtn": 2.83}},
                                        "memory": {"memfree": 577416, "memused": 440304, "memused-percent": 43.26, "buffers": 13168, "cached": 307444, "commit": 583764, "commit-percent": 28.28, "active": 233780, "inactive": 156988, "dirty": 0, "swpfree": 923488, "swpused": 123036, "swpused-percent": 11.76, "swpcad": 36652, "swpcad-percent": 29.79, "frmpg": -0.09, "bufpg": 0.06, "campg": -0.03},
                                        "hugepages": {"hugfree": 0, "hugused": 0, "hugused-percent":0.00},
                                        "kernel": {"dentunusd": 1309, "file-nr": 704, "inode-nr": 8817, "pty-nr": 2},
                                        "queue": {"runq-sz": 0, "plist-sz": 130, "ldavg-1": 0.00, "ldavg-5": 0.01, "ldavg-15": 0.05, "blocked": 0},
                                        "serial": [
                                                {"line": 0, "rcvin": 0.00, "xmtin": 0.00, "framerr":0.00, "prtyerr": 0.00, "brk": 0.00, "ovrun": 0.00}
                                        ],
                                        "disk": [
                                                {"disk-device": "dev253-0", "tps": 0.23, "rd_sec": 0.53, "wr_sec": 2.83, "avgrq-sz": 14.82, "avgqu-sz": 0.00, "await": 0.06, "svctm": 0.06, "util-percent": 0.00}
                                        ],
                                        "network": {
                                                "net-dev": [
                                                        {"iface": "eth0", "rxpck": 29.47, "txpck": 1.09, "rxkB": 1.95, "txkB": 0.73, "rxcmp": 0.00, "txcmp": 0.00, "rxmcst": 0.00, "ifutil-percent": 0.00},
                                                        {"iface": "eth1", "rxpck": 0.00, "txpck": 0.00, "rxkB": 0.00, "txkB": 0.00, "rxcmp": 0.00, "txcmp": 0.00, "rxmcst": 0.00, "ifutil-percent": 0.00},
                                                        {"iface": "eth2", "rxpck": 0.00, "txpck": 0.00, "rxkB": 0.00, "txkB": 0.00, "rxcmp": 0.00, "txcmp": 0.00, "rxmcst": 0.00, "ifutil-percent": 0.00},
                                                        {"iface": "lo", "rxpck": 0.09, "txpck": 0.09, "rxkB": 0.05, "txkB": 0.05, "rxcmp": 0.00, "txcmp": 0.00, "rxmcst": 0.00, "ifutil-percent": 0.00}
                                                ],
                                                "net-edev": [
                                                        {"iface": "eth0", "rxerr": 0.00, "txerr": 0.00, "coll": 0.00, "rxdrop": 0.00, "txdrop": 0.00, "txcarr": 0.00, "rxfram": 0.00, "rxfifo": 0.00, "txfifo": 0.00},
                                                        {"iface": "eth1", "rxerr": 0.00, "txerr": 0.00, "coll": 0.00, "rxdrop": 0.00, "txdrop": 0.00, "txcarr": 0.00, "rxfram": 0.00, "rxfifo": 0.00, "txfifo": 0.00},
                                                        {"iface": "eth2", "rxerr": 0.00, "txerr": 0.00, "coll": 0.00, "rxdrop": 0.00, "txdrop": 0.00, "txcarr": 0.00, "rxfram": 0.00, "rxfifo": 0.00, "txfifo": 0.00},
                                                        {"iface": "lo", "rxerr": 0.00, "txerr": 0.00, "coll": 0.00, "rxdrop": 0.00, "txdrop": 0.00, "txcarr": 0.00, "rxfram": 0.00, "rxfifo": 0.00, "txfifo": 0.00}
                                                ],
                                                "net-nfs": {"call": 0.00, "retrans": 0.00, "read": 0.00, "write": 0.00, "access": 0.00, "getatt": 0.00},
                                                "net-nfsd": {"scall": 0.00, "badcall": 0.00, "packet": 0.00, "udp": 0.00, "tcp": 0.00, "hit": 0.00, "miss": 0.00, "sread": 0.00, "swrite": 0.00, "saccess": 0.00, "sgetatt": 0.00},
                                                "net-sock": {"totsck": 77, "tcpsck": 6, "udpsck": 0,"rawsck": 0, "ip-frag": 0, "tcp-tw": 1}
                                        }
                                },
                                {
                                }
                        ],
                        "restarts": [
                        ]
                }
        ]
}}
ちなみに古いバージョンの sadf コマンドだと CSV 出力 (-d) をサポートしていない場合があるが tr コマンドなどで変換すると良い。
$ sadf -t -- -A | tr "\t" , 2>&1 | tee -a sar.$(date '+%Y-%m-%dT%H:%M:%S').csv
R で可視化
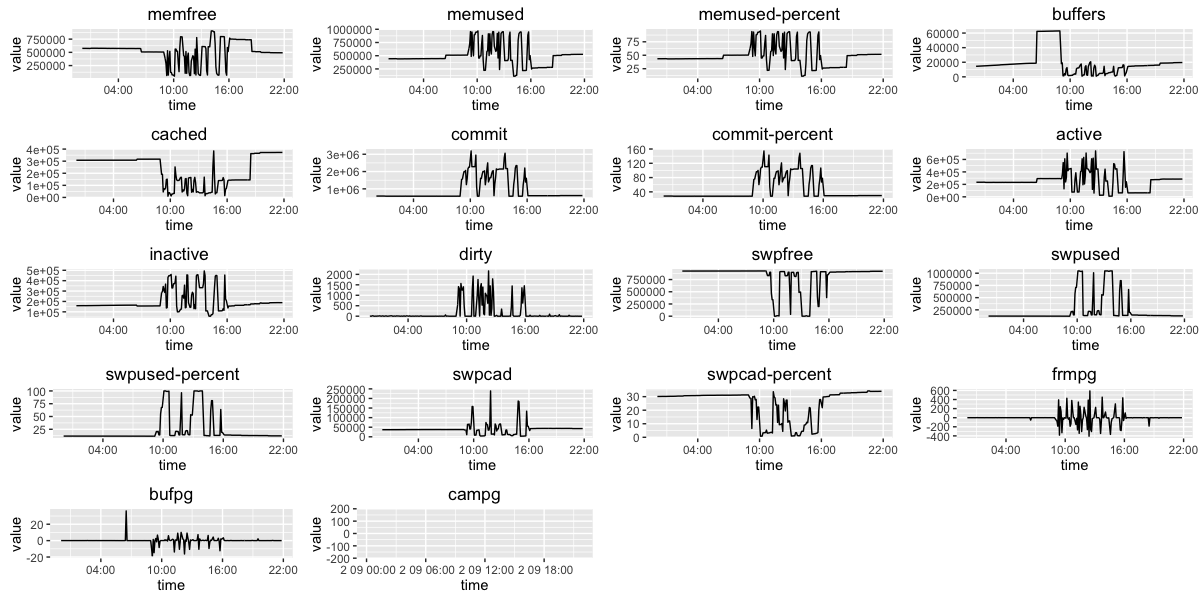
1日分のデータを JSON で出力した上で, メモリ情報の各項目を R で可視化してみる。
library(dplyr)
library(jsonlite)
library(ggplot2)
library(reshape2)
library(ggfortify)
library(scales)

# change working directory
frame_files <- lapply(sys.frames(), function(x) x$ofile)
frame_files <- Filter(Negate(is.null), frame_files)
setwd(dirname(frame_files[[length(frame_files)]]))

# from JSON
d <- fromJSON("data/sysstat.2017-02-09T21:52:56.json")
ts <- d[1]$sysstat$hosts$statistics[[1]]$timestamp
time <- as.POSIXct(paste(ts$date, ts$time), format = "%Y-%m-%d %H:%M:%S")

# Memory
mem <- d[1]$sysstat$hosts$statistics[[1]]$memory
mem.melt <- melt(mem)

l <- list()
items <- unique(mem.melt$variable)
for (item in items) {
  g <- ggplot(mem.melt %>% filter(variable == item), aes(x = time, y = value)) +
    labs(title = item)
  l <- c(l, list(g))
}

p <- new('ggmultiplot', plots = l, ncol = 4)
p[1:17] <- p[1:17] + geom_line() +
  scale_x_datetime(breaks = date_breaks("6 hour"),
                   labels = date_format("%H:%M", tz = "Asia/Tokyo"))
p
おわりに
R で list や vector に要素を combine する関数は c() なんですね。
Systems Performance: Enterprise and the Cloud の邦訳版 『詳解 システム・パフォーマンス』が 2017-02-22 に発売されます。楽しみです。
[1] sysstat/sysstat
[2] システムの状態を可視化する(その1)
[3] ps auxw したときに STAT 列に表示される値の意味
[4] System Activity Reporter (sar)

