Box-Cox変換について調べたのでメモります。
Box-Cox変換
Box-Cox変換 はデータの分布を正規分布に近くなるように変換する手法で, 正規性を仮定した分析を行う時に役立つ。発表 [1] は 1964年とけっこう歴史が古い手法である。
one-parameter の場合は, 以下で変換する。
R では より一般化された べき乗変換 car::powerTransform() で, Box-Cox変換のパラメータ λ を選択して, car::bcPower() で実際に変換する流れとなる。
λが 1/2 の時には square root, 0 の時には log, -1 の時には逆数で変換される。
例として論文の中でも出てくる Woolデータセット [2] を使う。4つの変数から成る。
Description

This is a three-factor experiment with each factor at three levels, for a total of 27 runs. Samples of worsted yarn were with different levels of the three factors were given a cyclic load until the sample failed. The goal is to understand how cycles to failure depends on the factors.

Usage

Wool
Format

This data frame contains the following columns:

len
length of specimen (250, 300, 350 mm)

amp
amplitude of loading cycle (8, 9, 10 min)

load
load (40, 45, 50g)

cycles
number of cycles until failure

Source

Box, G. E. P. and Cox, D. R. (1964). An analysis of transformations (with discussion). J. Royal Statist. Soc., B26, 211-46.
データの確認。
> head(Wool)
  len amp load cycles
1 250   8   40    674
2 250   8   45    370
3 250   8   50    292
4 250   9   40    338
5 250   9   45    266
6 250   9   50    210
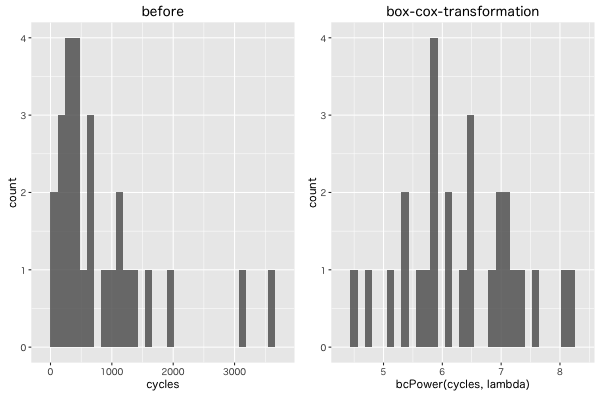
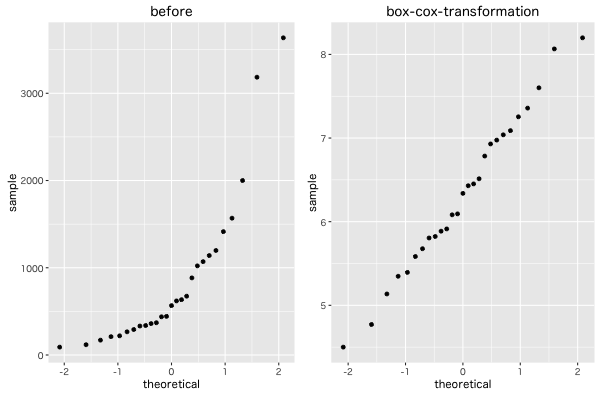
まず分布を確認する。左が元の cycles の分布。右が Box-Cox変換後の分布で正規分布に近づいている。
正規分布からの外れ値の確認には qqplot が視覚的に分かり易い。
cycles を目的変数として 3つの回帰モデルを作ってみる。
最初に, 変換しないで stats::lm() で正規線形回帰モデルを作ると Adjusted R-squared は 0.69 となった。
model.lm <- lm(cycles ~ len + amp + load, Wool)
summary(model.lm)
# Coefficients:
#             Estimate Std. Error t value Pr(>|t|)
# (Intercept) 4521.370   1621.721   2.788 0.010454 *
# len           13.200      2.301   5.736 7.66e-06 ***
# amp         -535.833    115.057  -4.657 0.000109 ***
# load         -62.167     23.011  -2.702 0.012734 *
# ---
# Signif. codes:  0 ‘***’ 0.001 ‘**’ 0.01 ‘*’ 0.05 ‘.’ 0.1 ‘ ’ 1
#
# Residual standard error: 488.1 on 23 degrees of freedom
# Multiple R-squared:  0.7291,	Adjusted R-squared:  0.6937
# F-statistic: 20.63 on 3 and 23 DF,  p-value: 1.028e-06
次に, cycles をBox-Cox変換した後の正規線形回帰モデル (Cox-Box変換モデル)だと Adjusted R-squared は 0.96 となった。
model.bc <- lm(bcPower(cycles, lambda) ~ len + amp + load, Wool)
summary(model.bc)
# Coefficients:
#              Estimate Std. Error t value Pr(>|t|)
# (Intercept) 10.551813   0.616683  17.111 1.41e-14 ***
# len          0.016648   0.000875  19.025 1.43e-15 ***
# amp         -0.630866   0.043752 -14.419 5.22e-13 ***
# load        -0.078524   0.008750  -8.974 5.66e-09 ***
# ---
# Signif. codes:  0 ‘***’ 0.001 ‘**’ 0.01 ‘*’ 0.05 ‘.’ 0.1 ‘ ’ 1
#
# Residual standard error: 0.1856 on 23 degrees of freedom
# Multiple R-squared:  0.9658,	Adjusted R-squared:  0.9614
# F-statistic: 216.8 on 3 and 23 DF,  p-value: < 2.2e-16
最後に今回の例だと cycles は目的変数であるので, 一般化線形モデルの方が自然なのかもしれない。
stats::glm() の線形予測子にガンマ分布, リンク関数に log を指定した。
model.glm <- glm(cycles ~ len + amp + load, family = Gamma(link = log), data = Wool)
summary(model.glm)
# Deviance Residuals:
#      Min        1Q    Median        3Q       Max
# -0.43387  -0.11573  -0.00931   0.10245   0.25346
#
# Coefficients:
#               Estimate Std. Error t value Pr(>|t|)
# (Intercept) 10.4420740  0.5907520  17.676 7.01e-15 ***
# len          0.0168502  0.0008382  20.102 4.33e-16 ***
# amp         -0.6311986  0.0419124 -15.060 2.10e-13 ***
# load        -0.0770519  0.0083825  -9.192 3.66e-09 ***
# ---
# Signif. codes:  0 ‘***’ 0.001 ‘**’ 0.01 ‘*’ 0.05 ‘.’ 0.1 ‘ ’ 1
#
# (Dispersion parameter for Gamma family taken to be 0.03161972)
#
#     Null deviance: 22.88393  on 26  degrees of freedom
# Residual deviance:  0.76935  on 23  degrees of freedom
# AIC: 332.76
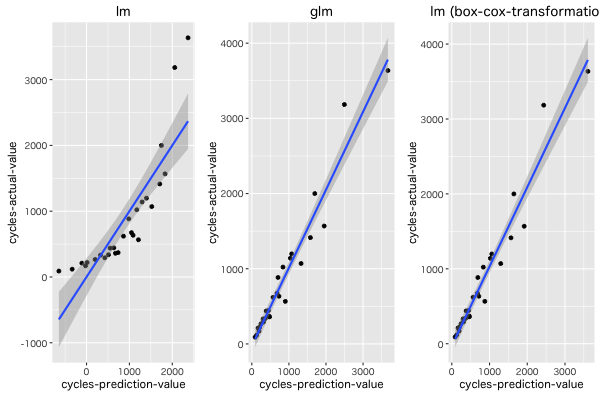
当てはまりを見てみる。glm と Box-Cox変換モデル はほぼ同じ値となった。AICでの比較は多少工夫が必要。
ちなみに, 上記では比較のために Box-Cox変換モデルの予測値を Box-Cox逆変換 で戻している。
bcInverse <- function(x, lambda) {
    if (lambda == 0) {
        exp(x)
    } else {
        (lambda * x + 1)^(1 / lambda)
    }
}
Codeは GitHub に置いた。
おわりに
Box-Cox変換は計量経済学でも使われているようです。[4]
所感としては, 説明変数に正規性を与えたい場合には良さそうだけど, 目的変数の場合は素直に一般化線形モデルにした方が良さそうかなと思いました。
一般化線形モデルについてはみどり本こと, データ解析のための統計モデリング入門――一般化線形モデル・階層ベイズモデル・MCMC (確率と情報の科学)がオススメです。
[1] An Analysis of Transformations [G.E.P.Box; D.R.Cox, 1964]
[2] 梳毛糸が切れた時の要因を調べるために繰り返し負荷を与えて測定したデータ (?)
[3] log 変換する?しない?AICでモデル比較するときの注意点
[4] 一般的なBox-Cox変換を使った線形回帰モデルにおけるAICの利用
[5] べき乗変換モデルにおける一致性を有する推定量について
[6] Box-Cox変換で変数を正規分布に近づける


